Content vs Time Template
Overview and Key Concepts
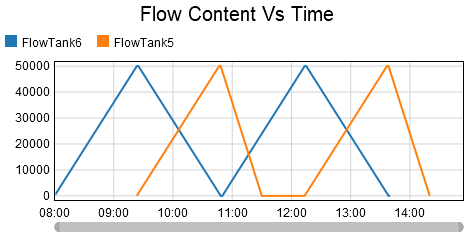 This template creates a line chart. This is contrary to the WIP vs Time template,
which creates a stair-step chart. Each specified object is represented by
a different color, which shows the flow (or bulk) content over time.
This template creates a line chart. This is contrary to the WIP vs Time template,
which creates a stair-step chart. Each specified object is represented by
a different color, which shows the flow (or bulk) content over time.
Chart Types
This section describes the Line Chart Template. The Content can be visualized using the following chart templates:
- Bar chart (current value)
- Histogram (distribution since start)
- Table (current value)
- Line chart (history vs. time)
The Options Tab
 The Options tab has the following properties:
- Objects - Specifies the objects to include on the chart. See Adding Objects for more information.
The Settings Tab
The Settings tab is identical to the Time Plot Settings tab. For more information, see Time Plot Settings.
The Colors Tab
The Colors tab is identical to the Time Plot Colors tab. For more information, see Time Plot Colors.
The Advanced Tab
This template, like all templates, uses the Advanced Tab. For more information, see Advanced Tab.